Google Maps Don’t Lie. Sweden And Canada Among Worst Greenhouse Gas Emitters.
by Erick Schonfeld on July 31, 2009

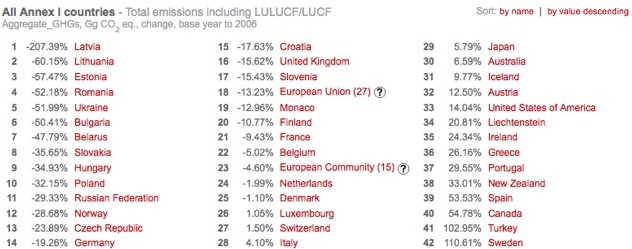
Which countries are the worst greenhouse gas emitters? Now you can see for yourself on this handy Google Map created by a department of the UN and Google. The map shows changes in greenhouse gas emissions from 1990 to 2006. Green is good (a decrease in emissions) and purple is bad (an increase).

So who are the worst offenders? Topping the list is Sweden! The country has managed to increase its emissions by 110 percent over that time period. So much for Nordic purity. Following Sweden is Turkey (with a 103 percent increase) and Canada (with a 55 percent increase). Yes, Canada. What is it with these northern countries?

You’d think the U.S. would top the list, but it is actually only the tenth worst country with a 14 percent increase in emissions (still well within purple territory). It is kind of embarrassing that Russia is greener than we are. But at least we are better than Canada (and Sweden).

Or are we? The map itself lets you drill down into the data to find out. You can sort by industry, type of emission (CO2, CH4, N2O, etc), or year, and if click on a country it gives you a detailed breakdown of emissions by economic sector and other variables. For instance, over the 1990 to 2006 time span, Russia has actually seen a 29 percent decrease in emissions, but if you look at just 2006, Russia starts getting pretty purple, and rises to the No. 3 worst emitter. And the USA rises to No. 1.

Hey, we’re No. 1!

Sigh: Apparently, some people in comments and elsewhere thought this post was dead serious. It is really more about the cool Google Map application than the global warming data it illustrates. But for those readers who are humor-challenged (or Swedish), this post was in fact written with tongue firmly in cheek. You see how at the end I completely reverse myself and point out that the USA is actually the worst emitter, but then try to spin it as something to celebrate? Yeah, that would be the giveaway.

Advertisement

Comments rss icon

  • That is so cool, way to go Sweden and Canada, Let me now if you want to promote your green message.

    • Why would you care? Global warming is fake anyway.

      • thank you!

        humans are bad! why oh why do we let ourselves continue to breathe? I’m such a bad person for wanting children! Green is my new religion!

        Please differentiate between caring about the environment and this new gov’t-run environmentalism (= federal land grabbing via buffer zones and buffer zones for those buffer zones AND carbon emissions taxation scams).

        See ‘The Green Curtain’ (40 mins)
        http://video.go...453684194357754

      • I like your quote in your bio line on Twitter: “I intend to live forever. So, far so good.” Ironic.

        I wish “global warming” wasn’t called what it is. “Global climate instability” would be much more appropriate. Regardless of whether it’s fake or not though (I find the evidence to point toward it being true), the initiatives it brings about are definitely worthwhile.

        • Have you been diagnosed for Stupidity?
          How can you see no evidence for it being true.
          Oh, I get it, you are legally blind.

          • Me: “I find the evidence to point toward [Global Warming] being true.”
            You: “How can you see no evidence for it being true?”

            Um, I do see evidence for it being true. That’s what I just said.

          • Actually environmental science is like particle theory – there is no definitive proof that we as humans CAUSE climate change – although we can influence it surely. What more and more “theorists” are saying is that with the combination of the Sun increasing in temperature (that is science) which has a direct effect on the planets temperature increase of recent years, we are seeing a rapid melting action in the poles and erratic weather patterns due to more moisture (along with chemicals) in the atmosphere.

            The changes are are seeing, in other words, are not a “problem” we caused but something we are moving along much faster then we would like to see. Change blows, especially when you might be the one to be “changed” ie wiped out. So we are not doing ourselves in like the government would like us to think – science suggests otherwise, theorists just theorize based on public opinion and what they are pressured into doing – if the governments really wanted change they would enforce it swiftly instead of this preschool pandering they continue to heap upon us.

            Actually research this climate stuff from MULTIPLE sources (takes a few minutes here and there) and change your OWN habits – the governments and big business won’t do it, so public opinion has to take a back seat to public action. Tirade over. Learn to swim. :D

          • @Nick again: If you’re thinking I don’t believe global warming for the reason of preferring to refer to it as something like “global climate instability” rather than “global warming”, that’s just a misunderstanding. Sure, global warming is happening. With the masses though, “global warming” gets misconstrued–that was my point.

            I live in Wyoming and we’ve definitely had a very wet, cool summer compared to the typical non-stop scorching. All the time around here, I hear others laugh it off saying: “Haha, global warming my ass!” (and they’re serious about it). Not to demean them, but, they’re not aware of the effects of the jet stream on climate.

            That was my point.

          • @Nick
            very eloquent… dude.

            “Have you been diagnosed for Stupidity?
            How can you see no evidence for it being true.
            Oh, I get it, you are legally blind.”

            The fact is that there is plenty of evidence to says that it’s a natural cycle as well, you just hear less about that… so, there is no need to get snotty Nick.

            I think more important is that we might want to pay attention regardless of what we are told, and make sure we can live on our planet in the future… if “global warming” is an issue, is it one we control or cause? if it’s not something we control or cause… can we control it? Do we need or want to?

          • well, the point is (whether human caused or not) is that there a a lot of things changing, which are starting to cause problems and the problems are getting more and more serious. well and politics is fake, what a surprise.
            besides the study is misleading, a good example of how to use statistics in a wrong way… it doenst tell who is the biggest emitter, but who is increasing its emission (sweden is a small country, so its not very important in a global view). And what about China, Brasil and Indien? They dont exist?

            Here’s a nice movie on the things that are changing and the problems coming with this:
            http://www.yout...re=channel_page

        • I wonder why some people think that global warming is a fake. There are plenty of evidence!

      • well global warming ain’t so fake in N.Europe mate… we got the melting poles raining on us – from Dublin to Berlin. Just the check any weather report

        • Our icy poles have been melting for at least 13,000 years — since the peak of the most recent ice age:

          http://www.uvm....ialHistory.html

          And CO2 concentrations are LOWER now than they were in the past:

          http://tinyurl.com/co2-truth

          All you globalwarmingsts need to find anther topic to fear monger with.

          • True. You’re right Randy. But we’re in a bad situation, wouldn’t you agree? I mean that normally in N.Europe (well at least in N.Western Europe) we should be receiving nice, hot & dry weather… by now.. well, we’re not. HAHA. and this has been going on for the past 3 years (on a full-on, hardcore level that is, ie, fuck load of rain). You think think this is really normal? I don’t

          • Ahh, nice links.

            In fact I read that last year the ice pack got larger again, although I don’t have a source for you, I’m sure it could be found (being scientific measurement data).

        • Perhaps fake isn’t the right word, but the idea that we are causing it rather than accepting the possiblity that upper ionospheric heating systems such as HAARP are behind it, is a bit of BS. The common man/woman only has the faith-based decision to make based on the information they consume…such a decision does not make something true or false. It is just a belief and beliefs can be manipulated.

          Whatever the case is, let’s get the gov’t out of the equation because soon they will be reaching into my pockets and yours while trying their hardest to shame us into forking out our hard earned cash…which is being taken from us anyway via our serfdom, I mean, taxation.

          True choice (not just the illusion of it) is always good. Green living will eventually seek to eliminate my freedom of choice by forcing me to rely on local sources (through economics or product availability) while cramming me into the city because ‘nature is sacred’, so sacred we must all become urban-dwellers (thereby taking away more of my freedom of choice).

          All of a sudden, we are going to wonder why we are even printing money (cough*backed by the very thin air we will soon be taxed on*cough). Let’s just all go digital because online is safe, right…

          my 2 cen….err, digits.

          • That makes no sense.
            The (capitalist) banks are the ones responsible for the current economic climate.
            Not the government.
            This sort of libertarian argument is illogical if it was not taxation that led to trouble, but the opposing belief that the free market should rule supreme.

          • Nick,

            In my post, I didn’t speak of the current economic climate, just the climate (as in the weather). I am stating an opinion that power and money are more likely than not, one in the same. Banks or gov’t, they are both manipulators.

            The part on (general) taxation was a bonus, not the meat of my argument. Taxation from the current farce (carbon credit scams), does have a place in my argument. It’s as much of a farce as saying if I don’t wear a gdfjghidufhs-colored shirt, I should be fined.

            “Wait a second! That’s not a color? But all the media outlets and the people I blindly trust (experts) are telling me it is! You think different, get out of here!”

        • The probable reason that more fuel is burned in canada is because its colder in canada and northern countires,
          Hydrogen powered cars are probably not gonna fair so well in areas with such cold climates, solar power might be helpful, but its still bad to build, from what I understand, because of things like toxic materials used to build them.
          if you want perfect climate results, you might as well just tell a million people to stop breathing, Not likely to happen, since Im sure china probably already tried, especially with the whole controlled childbirth thing.

      • it’s change % not absolute values.

        Sweden is one of the world’s greenest countries. see the yale EPI index

        what this shows is that swedes have increased their eco footprint, but it was very small regardless.

        Don’t try to hide the fact that US lags way behind to being a green country

    • Anyways, the map shows the “increase” of gas emissions since 1990. What it does not say is the total amount of emissions by country… then I bet Canada/Sweden wouldn’t look so bad.

      • Of course they wouldn’t look so bad, they have smaller populations.

        It’s the point of the matter. While most have been at least making some attempt to lower emissions, the two holier-than-thou nations have done the opposite. Sure, the US has increased, but for 8 years they were pretty damn honest about it, and you can’t beat a “I’m not green and don’t want to be” message.

        Global warming is largely nonsense anyway.

        • @Bob Jones
          “Of course they wouldn’t look so bad, they have smaller populations.”

          I’ve stared at your comment for quite some time now, trying to convince myself you are joking. …Nope, maybe you are serious.

          The U.S. have more than 3 times the CO2 emissions/capita of Sweden. (US 19.8 tonnes/capita; Swe 6.4).

          The Google maps statistics mashup above sucks, it’s misleading and incomplete. Look here instead:
          http://www.guar...carbonemissions

      • Don’t people know “% increase” is way different than total ?

      • Olalonde you’re absolutely right.

        This map is very misleading. Change the 3rd dropdown to “2006″ and you’ll see the reality.

    • We have a green message in Canada?

    • Nothing like leaving out most of Asia, all of South America, and Mexico. Seems like a bit of US bashing going on with this map.

    • Don’t be one of those myopic homers that buys into every stat published at first glance. It just cheapens the whole discussion, and it’s one worth having.

      Now I can’t validate the methodology, etc associated with this data, but let’s assume it’s right. Sure Canada’s going the wrong way here, but what of per capita use? What if by increasing we’re still waaaaaaaaaaaaaaaay below the U.S.’s per capita production of greenhouse gases and energy use? Bit of a different story from that angle, no?

      Stats are fact and fairy dust at the same time. Treat them with both respect and skepticism and you won’t go wrong.

      Either way, still disappointing to see Canada moving upward.

  • Everyone should take a look at this…
    http://www.yout...h?v=jqxENMKaeCU

    regards,

    Martin

  • No, I am not a bot, trying to advertise some nasty site, that video is very relevant to the topic at hand and should be watched by as many ppl possible… :D

  • yeah wait till they put China on the map

  • Wow. I’m a swedefag, how did this happen?

  • Damn Canadians with their CO2 and poutine fries. Just gotta have cheese AND gravy, huh fatties??

  • Oh please, Google Maps can’t even give accurate directions to my house.

    I don’t doubt greenhouse gasses but to use Google Maps as a scientific resource just denigrates your argument.

  • Big problem in Canada is the extraction of oil in the sands of Alberta. Too bad our prime minister comes from there…

    • Ugh, Canadians.

    • Wrong, Stephen Harper is *not* “from” Alberta. He was born in and grew up in the Toronto area (Leaside, then Etobicoke), and moved to Alberta to work in the mailroom of the company his father worked for (Imperial Oil… go figure??), after dropping out of U of T.

      But his public persona is all West, all the time. Who’d have thought?

      Posters here assuming that the Government of Canada has a “green message” or is holier than thou on climate issues on the global stage isn’t paying attention. With Harper at the helm, Canada has been one of the top obfuscators on climate change in the global political arena.

  • I seriously doubt Sweden is number one. Especially with all the “no data” countries, like China for instance. Nobody can be first or last when the results haven’t been counted for some of the most-offending countries yet…

    (And it’s SUCH a relief to comment on this page, after attempting the new comment system on a recent post here…)

  • FYI, Turkey isn’t a “northern country”

  • This doesn’t show the ‘greenest’ countries. In order to do that you’d want to show either total emissions or emissions on a per capita basis.

    This shows the change in emissions over a 10 year period. The US was the biggest spewer of greenhouse gases in 1996 and has only gotten worse. Canada was much smaller (much smaller population) and has increased more on a % basis, but the US’s increase represents a much larger absolute increase in emissions.

    • Correct. On the map, US still emits 10 times (7,017,321 Gg CO2 eq.) more greenhouse gas than Canada (720,632 Gg CO2 eq.) and 100 times more than Sweden (65,749 Gg CO2 eq.).

    • Yes, but the US is much bigger. Sure, they’re not good per-capita. But, when you’re increasing your power usage at a faster rate than the Americans, you should know something is wrong. Are Canadians and Swedes even bigger? Or have they just discovered gas guzzlers?

  • 1) A high positive derivative does not mean they are the worse emitters – just possibly on track.
    2) I’d love to see rapidly developing countries, which under this metric, would blow everyone away.

  • AND this is just the increese in greenhouse gas emittion… U.S.A still has way more emittion per capita compared to Sweden

  • To be fair, it’s fucking cold in Canada.

  • This title is so unfair !!

    Because when I go on the website and actually look at the data the only one country that seem to suck in terms of GHG emissions is… USA !

    Ok well, Sweden’s emissions increased 110 smthg %. (I believe they decided to stop using nuclear energy and they shut down their nuclear plants -which is not smart by the way). in absolute values and according to this map, it gives:

    Sweden: (1990) 13,172 Gg CO2 eq. => (2006) 27,742 Gg CO2 eq. (yeah 110% increase)

    USA: (1990) 5,410,620 Gg CO2 eq. => (2006) 6,170,528 Gg CO2 eq. (yeah you read 222x more than Sweden)

    So my point is that when you compare growth percentages it DOES matter to know where you start from. If you start counting in 1990 when the USA where already polluting at extremely high levels and Sweden may have been using a lot of nuclear power (so less CO2 emissions) then it is easy for the US to look better than Sweden in term of growth 16 years later.

    Too be fair we should also look at the level of emission per inhabitant for both countries and it gives:

    Sweden: 27742/9millions => 0.002991 Gg CO2 eq.

    USA: 6170528/305 millions => 0.020186 Gg CO2 eq.

    yeah that means even after a 110% increase in sweden, the average US person emmits roughly 6-7 times more CO2 than the average Sweed.

    So considering the USA emmit so much CO2, it is kind of sad to see that they were able to increase that pollution even more unlike other comparable “countries” like EU or Russia.

    For Canada, I didn’t do the maths but I don’t expect the figures to look too good since we all know they produce a lot of heavy oil. And it is a huge source of GHG emissions. But guess who are Canada’s oil first consumers ?

  • The only thing worse than the Canadians are the French.

    Baguettes? Common Jacques!

  • The second I saw this I ran out and started the hummer and it is still just running in driveway.

    #14 is just the 14th loser.

    Nobody can say I am not doing my part.

    BTW – I also through out all of those gay light bulbs that look like chubby slinkys

    no wonder our economy sucks!

  • Geez, anyone with some math knowledge knows this isn’t a fair comparison and that the title doesn’t reflect the data.

    Some more research before writing, please. And I mean please please, Techcrunch. You have a level of quality to uphold.

    • Turkey is high on that list only because it has been rapidly developing in the last decade. Rather than acting like a sensationalist tabloid, link to real statistics like a particular year like 2006.

  • Do your research, the USA is by far the worst offender. The reason the USA has a good growth color is because they have output crap for 16 years straight.

  • There sure is a lot of white on that map, particularly in beef-producing regions like south america and factory-wastelands like southeast asia…

  • Lame article. The title does not reflect the content.

    The data shows the countries with the biggest increases in greenhouse gas emissions.

    It doesn’t show which countries are the worst greenhouse gas emitters, either per capital or overall.

    Please fix your headline.

    • Nope. Sorry. Calculus wins, you lose.

      Author’s title is correct.

      Hey, why don’t you do everybody a favor: paste a news link here of a single reported death from “Global Warming” so we can all take wonder at its massive devastation.

  • This is increase percentage, or real amount of emissions?… it is not the same 110% incresease of 10, than 14% increase of 10,000.

  • Please tell me how Russia could be getting better and that China and India are not included!? This map is very misleading.

    Maybe this has something to do with it? http://en.wikip...col_signatories

  • This map, the one posted above, is very misleading! Follow the link to the active map, play with it, you will notice some interesting “facts”.

    Also, as I said earlier, add china and india in the mix and all other countries will look pristine!

  • LUCF = Land Use Change and Forestry

    LULUCF = Land Use, Land-Use Change and Forestry

    http://unfccc.i.../items/1084.php

  • “What is it with these northern countries?”

    They’re FREEZING.

  • Erick, your analysis is usually so brilliant, but here again we have a post that withholds key elements of context for an understanding of the phenomenon in question. OK, we have data that shows what GHG countries produce and how much that production changes over time. Do we have other data showing how much the trees in the 2nd largest land mass (Canada) scrub from what’s been produced? Any data on the increase in cleaning efforts? The shock value of net production seems like little more than propaganda when lacking a comparison with the gross or with global totals, or with an sense of what any increases actually PROVIDED (gasp: you mean energy emissions may have actually been USED, to produce a net BENEFIT for someone?). For a business buy, you have sure shown better ability with stats in the past than this.

  • This is supposed to pass as journalism?
    Ugh.

  • Increase doesn’t mean much if the baseline is low.

    Also, Sweden and Canada have some serious tree density. They can afford to increase their emissions.

  • the whole title of this article is a disaster

    “Google Maps Don’t Lie. ”
    it’s not google maps data, it’s UN data

    “Sweden And Canada Among Worst Greenhouse Gas Emitters”
    Sweden? the #3 greenest country in the world, orly?
    these are not even absolute gas emissions. read the fine print:

    Aggregate_GHGs, Gg CO2 eq., *change*, base year to 2006

  • doesnt it just show that their ecconomies have grown?

    and then look at britain. sigh

  • What would be more telling are numbers related to final consumption, rather than production.

    For example, Canada has 1/10th the population of the US, and a lot of our natural resources (energy intensive and polluting, such as pulp/paper, oil sands, natural gas, etc.) end up being exported to the USA, where they are consumed. Should those emissions be counted towards Canada’s total, or would it be more relevant if those are counted against the USA?

    Similarly, suppose Sony (owned by the Japanese) builds a TV in China, which is then bought by someone in the US. Emissions are in China, where the TV is produced. Should the emissions count towards China, or should it count towards the US, or should it maybe even count towards Japan (whose shareholders made the profits on the sale of the TV!)?

    With international trade, and multinational companies, these become very complicated issues, far beyond national politics.

  • The Swedish data comes from a faulty NIR report: “This report is an updated version of the original Swedish NIR submission 2008. The reason for the updating was a calculation error identified in the whole time-series
    1990-2006 of the LULUCF sector. The whole data set for the LULUCF sector has
    been updated in the CRF-tables and the in relevant text in this report. All affected
    totals have also been changed.”
    http://unfccc.i...8_nir_14apr.zip

    Looking at the corrected figures, Swedish emissions (40 162Gg) are at 1990 levels (39 990Gg). Without LULUCF we have reduced emissions from 72 043Gg to 65 749Gg CO2E.

  • Just in case anyone is looking at this and saying “WTF?,” please note that the map does not have data for enormous emitters, such as China and other developing countries. This mostly reflects countries with relatively advanced and open measurement and reporting practices.

    • Enormous emitters? China may have overtaken the US in 2008, but America is still up there with any list of enormous emitters.

      Over the past decade you would need a whole new colour to cover the % change in emissions for China (and India to a lesser extent), but in overall emissions the US and China are relatively comparable.

      As other have said above, the only fair comparison is emissions per capita, and currently developing countries including China and India are so far below the west that it is rather hypocritical for us to preach about their evils, especially when our emissions continue to rise.

      At least most of Europe appear to be starting to reduce emissions, it’s time for America and Canada to step up.

  • Colder countries like Canada and Sweden need to burn more fuel to keep warm. Where’s the mystery in that?

  • Is this just the start of the US conspiracy theory to attack canada? It’s Canadian Bacon all over again!

    Actually, two interesting points here.
    Canada has been increasing Co2 emissions for two reasons
    1) mining the tar sands for oil that we send to the US (even though US may not be the final market, the refining is done in the US)
    2) Canadians have strangely been buying more SUV & trucks in the last few years, rather than less

  • Small denominator fallacy –

    It’s like hyping over some tiny startup because it’s experienced 70000% growth in the past month!!

  • Why the hell is Greenland shaded I doubt they would have anywhere near what the rest of the shades countries create or are they paired with Denmark.

    If so why doesn’t it say Kingdom of Denmark instead of Denmark since there two different entities.

  • I could care less, but the reason Canada emits more greenhouse gas is likely because it is further north. I’m sure weather pattern play a role as well.

    Russia does not have as much industry as America, thus, it is ‘greener’… but if we’re talking CASH, we’re greener ;)

  • we are all in it together, one planet, one people.

  • wtf does this have anything to do with a tech blog? flame bait.

  • And the white countries? Non offenders?

  • The data seems questionable. How is it possible for Latvia to have a 200% decrease in emissions? 100% would be the maximum.

  • Erick Schonfeld, you are loosing sight of your responsibility that a journalist with a large audience has. If you are writing provocative posts about companies it’s one thing. But making false statement in such an important matter and underlying them with correct but inapplicable data is below tabloid level. Shame on you.

  • Ha Ha Ha the U.S is canada leftovers…..

  • Who can prove Google Maps don’t lie?

    • ferridder proved it. Google Maps do indeed lie in this case.

      Swedens increase is due to an incorrect LULUCF value.

      You can change the view to see Total emissions without LULUCF if you wish.

  • wrong title. the worst emitter is the one emitting most. if I light a cigarette, which I usually don’t, I’d increase my emittance by 100%. would that make me greenhouse killer number 1? very misleading service and article.

  • This post contains some of the worst sins of blogging. The title is at least very misleading. This post was written with no further verification. In addition, the conclusions are wrong and based on the wrong dataset…

    • Agree, a catchy title is ok. It’s all about making headlines which lead me to this (hypocrite) post. But taking some data to make a false claim is a lie at tabloid level. At least I’d expect some updates/corrections in the usual blogging fancy. No word about Co2 per citizen etc, just a tiny subset of data to make an hilarious statement.
      Let’s compare that static Co2 emmission to the development in the north eastern Manufacturing-Belt. Man, I smell Pulitzer Price in the air.

Leave Comment

Commenting Options

Enter your personal information to the left, or sign in with your Facebook account by clicking the button below.

Alternatively, you can create an avatar that will appear whenever you leave a comment on a Gravatar-enabled blog.

Trackback URL
Short URL
bugbugbugbug
Techcrunch on Facebook