The adoption cycle for Twitter is a bit strange. It goes something like this: Ever-increasing waves of hype, links, and attention bring in the newbies to Twitter.com where they get their first taste of Twitterdom. Some portion of those set up an account out of curiosity or a fear of being left behind. They try sending out a few Tweets, look around, get bored by the initial banality of the service and abandon it for other pursuits.
But that is not the end of it. A lot of them come back, either because they keep getting links from friends or keep hearing about it on TV or whatever, and then they slowly start to see the usefulness—a funny Tweet from a friend, a link to breaking news, a way to keep an eye on the general zeitgeist. Twitter is the kind of thing that is easier to experience than it is to explain. But it is an acquired taste and often requires repeated exposure before people get hooked. Once they do get hooked, there is no going back.
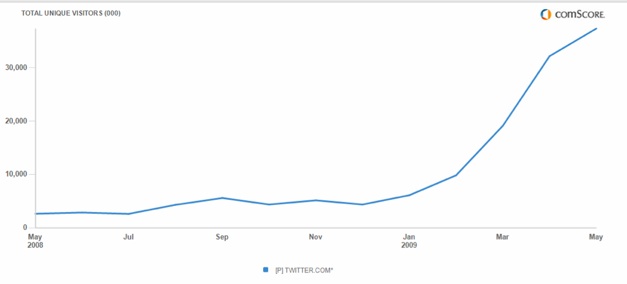
A good proxy for the level of general curiosity about what is on Twitter is how many people visit its Website. The worldwide numbers are out from comScore. In May, 2009, 37.3 million people visited Twitter.com, which is up 16 percent from April, 2009. The monthly growth slowed down from the 68 percent in April, but was not as flat as the 3.5 percent growth comScore reported for the U.S. in May.
Remember that these are month-over-month growth rates. The annual growth rate for global unique visitors in May, 2009 was 1,334 percent. And none of these numbers include the activity spurred by the Iranian elections in June, which I suspect will add to a pickup in month-over-month growth once again.
But let’s dive a little deeper into the data. The 37.2 million visitors include both people who use Twitter.com as their main interface with the service and curious visitors who aren’t necessarily registered users. About half of all active accounts, by some measures, access the service by desktop and mobile clients, and these numbers don’t count those. To some extent, the comScore number is a good measure of the general curiosity in Twitter for any given month. It doesn’t tell us the abandonment rate, but it does give us some peek at engagement.
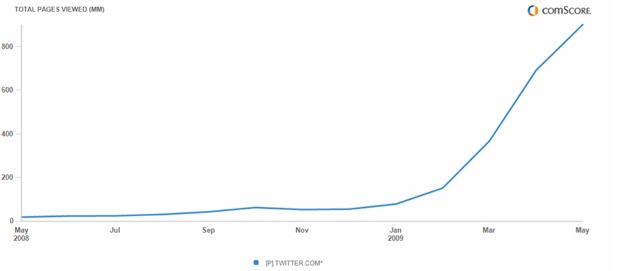
Most people consume Twitter in a passive, sheep-like manner. They read other people’s Tweets more than they produce their own. How do we know people are reading stuff on Twitter? Look at Twitter’s pageviews. They are up 30 percent month-over-month to 900 million pageviews globally in May. So pageviews are up twice as much as unique visitors, which implies that each visitor is looking at twice as many pages as they were the month before.
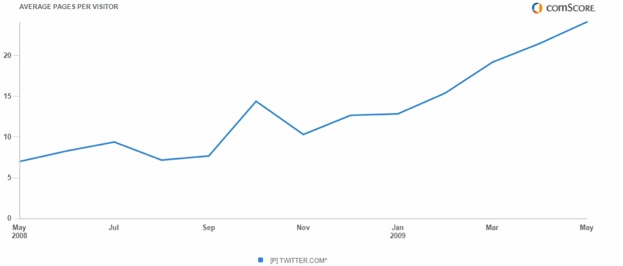
And if you drill down deeper, the average pages per visitor is up to 24 pages per visitor per month, which indicates an almost-daily habit on average. That number is up from 13 pages per visitor per month in January, and 7 pages per visitor per month a year ago. In other words, the addiction is growing.