Wakoopa’s First State Of The Apps Shows What We’re Using, When And How
by MG Siegler on April 28, 2009

picture-510As a service whose sole purpose is to track the applications that people actually use on their systems, it should be no surprise that Wakoopa has a lot of interesting usage data. On a day to day level, Wakoopa’s data is good, but it’s the aggregate data over long periods of time that can be really meaningful to show how we are using our computers. Today, Wakoopa has released the first such aggregate data with its inaugural State of the Apps report.

The report shows the quarterly data for desktop software, games and web apps. The data comes from the over 75,000 Wakoopa users that have installed the desktop tracking software to enable the company to see actual usage. These users have logged over 525 million hours of app usage, across over 200,000 apps.

Some key trends that Wakoopa highlights in its report include:

  • Social networking usage tends to peak between 9 and 10 PM. But for Facebook, the most popular social network, usage is pretty constant throughout the day.
  • Other web apps tend to peak at between 4 and 5 PM.
  • As you may expect, Twitter usage is rising quickly among Wakoopa users as well. Nearly a quarter of them now use the service — and most of them do so through Twitter desktop clients.
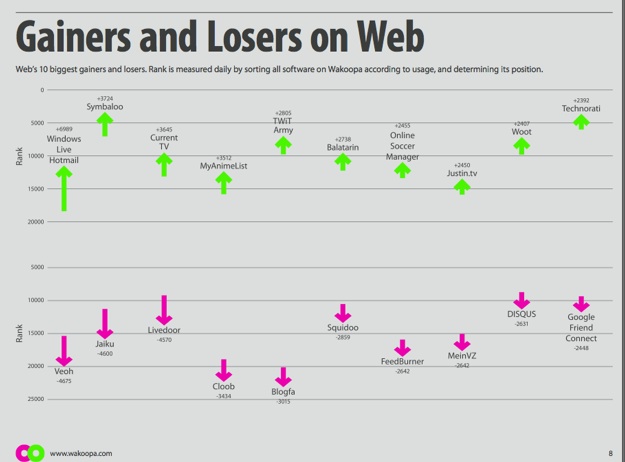
  • Google Friend Connect and the online video site Veoh both showed large declines in usage in the first quarter. Interestingly, and perhaps not entirely unrelated, Veoh just went through layoffs and a major restructuring. Google Friend Connect meanwhile, seems to lack the hype and adoption of Facebook’s more popular Facebook Connect.
  • Google Chrome is growing quickly, and is now past 15% usage across all Wakoopa users.

But some of Wakoopa’s charts in the report contain even more interesting information. For example, while Chrome has an impressive showing across the board, Mozilla’s Firefox browser is even more impressive. It is the number one app on both Windows and Mac platforms. And in every continent besides Africa, it’s over 60% usage among web browsers — and in Africa it’s still at 50%.

Meanwhile, Africa is the only continent where Internet Explorer finishes as the second most-used browser. On every other continent,  IE is in third place among browsers — or worse. While that may sounds a bit ridiculous given that IE is still by far the biggest browser worldwide in terms of market share, that has to be very troubling for Microsoft as it’s probably safe to assume that a lot of Wakoopa users are early adopters of technology and could signal a trend of where things could go for the general population in the coming years.

Also not a good sign for Microsoft: The older you are, the more likely you are to use IE. In the youngest age group, 11 to 20 year olds, even smaller browsers like Opera beat it. IE has been losing market share at a steady pace for the past several years.

picture-210

Google products dominate the top-used web apps. Gmail is #2, YouTube is #3, Google Search is #4 and Google Reader is #5. It seems pretty surprising that YouTube and Gmail would be ahead of Google Search, but perhaps that’s because people use their built-in search toolbars rather than Google.com to start searches. Also, a commenter Kyle notes below, Wakoopa tracks how long your stay on a site as well, so you’re more likely to stay on Gmail and YouTube longer than Google Search. Regardless, Facebook trumps them all.

On Windows machines, a lot of Microsoft products appear in the top 10, which on Macs, a lot of Apple products do. That is not at all shocking.

FriendFeed usage is more than halfway to Twitter usage — though it’s not clear if that’s just Twitter.com or if that includes the various clients as well. And FriendFeed’s usage is higher among Wakoopa users than that of MySpace. Again, I’d point back to the whole early adopter thing.

DestroyTwitter — which I had never even heard of until tonight, is one of the hottest new apps on both the Windows and Mac platforms. Apparently, it’s an Adobe AIR-based Twitter client that constantly updates, yet uses less memory than other AIR-based Twitter clients.

It’s interesting that email peak checking time for the weekday is during the morning, around 11 AM, but on the weekend, it’s at night around 9 PM.

picture-315

Advertisement

Comments rss icon

  • How do we know the stats is authentic? Has Wakoopa got a previous record/history of giving such stats? (However, the trends do apply to me. I use FB from 9-10 PM, use other apps between 4-5, use Firefox, hate IE and love gmail & youtube.)

  • “It seems pretty surprising that YouTube and Gmail would be ahead of Google Search”

    The reason for this is that Wakoopa doesn’t just track page hits but active time using the web service. You might just spend a few seconds searching but much longer reading and writing email.

  • Where can we find the original state of the apps report?

  • Wakoopa is a great data source for software and web developers. I’m really curious about when and how they are going to monetize their platform. Selling these stats? Giving software developers extra insights in their own software usage? Or extend their advertising model? I think Mindy Hull can really help them with that.

    BTW, State of the Apps report, how is it released? Cant find it on their blog or on my Wakoopa dashboard.

    • Wakoopa’s next step should be to dig (a little) deeper into the apps to get more useful information like which Firefox add-ons are the most popular or which services are being used by clients like Twhirl or RSS readers which can connect to many services at once.

      Of course these features should all be opt-in.

    • @ Jelmer: Thanks for the comment.
      @ kylehase: in the works as well. keep your feedback coming to us via the Wakoopa blog or email as bizdev AT Wakoopa DOT com.

      Wakoopa is working on the monetization strategy as we speak. The State of Apps report was sponsored by Pearson, the company behind well-known global brands including the Financial Times, Penguin books and Pearson Education. We have a number of things in the biz dev pipeline at Wakoopa – some of which have been touched upon here in the comments.

  • Thanks for the writeup MG!

    Unlike the web, software a field where not so much analytics and real usage data is available. We hope to break this emptiness and give some real insights into what’s happening in software.

    @writerkols: This is the first time we released such a report and it’s compiled from (anonymized, aggregated) real usage data from Wakoopa users.

  • I have been using this service some time now, and find it really interesting. This new "State of the Apps" report is extremely powerful and will be a great reference for software development and industry enthusiasts.

  • it’s reverse logic. 75k users is not a big enough sample to make these claims. You could say that firefox users are more likely to use wakoopa, but making a claim as to the popularity of ie vs firefox, that’s impossible.

    I wonder about the age stats though, our family of 5 shares a computer, would wakopa be able to see the difference.?

    It’s a nice idea but probably more accurate when they have 7.5m users.

  • OMG MG

    Have you actually looked at these charts? Who are these Wakoopa users? They’re definitely not representative of any segment or geography known to comScore, Nielsen or Wikipedia…

    So according to this Dutch site, IE actually has 6% share of minutes (SOM) on Windows machines compared to 28% on FF? and less than Chrome??? Yeah right.

    May I suggest that the only users of their toolbar are Google fanboys… There’s no way someone can learn anything from their data other than answering the question “What do Google geeks do”.

    If I were Wakoopa I would wait with sharing any data before I start getting some normal users to download my toolbar.

    • You make a good point. Their sample is certainly not representative of all computer users. The following are some things that limit their sample.

      - Windows and Mac users. No Linux tracker (Linux tracker in beta).
      - Primarily English users since the site and client are not localized.
      - Enthusiasts who keep up with tech enough to know about the service.
      - Those who are not too concerned about privacy. This pretty much excludes all business computers.
      - iPhone users. No WinMo, Symbian, Android, other mobile trackers.

      Still, they have a lot of data on a large user base and that in itself is useful information especially if these users are early adopters since it could show a trend of things to come.

  • I like Wakoopa, a Dutch company btw. http://wakoopa.com/wim66

  • 不错 firefox 很猛啊

  • Okay, so, I use both a windows system and a Macintosh – and the usage stats – Google Chrome > Internet Explorer? Firefox 29%? Adium, Itunes, Mail and VLC ranked #4,#5,#6,#7? – are bizarre to say the least. These user represent some minority of a minority that almost exactly parallel my usage.

    I guess my usage is interesting to some – but it’s certainly not representative of the real world.

    Though, I’m constantly amazed to see how many “novice” Macintosh users have Adium on there system….

  • I rate Wakoopa as it’s not intrusive and just runs in the background. I have it installed on my desktop computer but haven’t got around to installing on my laptop yet :)

  • Great article MG!

    @boba: 75K users may not sound like a big number but Wakoopa’s user base is comprised by a very tech savvy audience of people who are early technology adopters by nature.

    More info about the report can be found on Wakoopa’s blog:
    http://blog.wakoopa.com/

    Get in touch with us at bizdev AT wakoopa DOT com if you’re interested in additional details about the report.

  • sorry, but are 75k users a statistically significant sample size to put any sort of trust into these numbers? i’d argue it isn’t. get at least 1% of the internet population signed up and using the service before coming out with any data.

    and get a broader spectrum of users while you’re at it; because it sounds to me like you have a lot of early adopters and web geeks using wakoopa. as one commenter above noted, that’s a “minority of a minority”.

  • It baffles the shit out of me why people knowingly install spyware. Who knew the trick all along was to call it "social" and people would opt-in to this?

  • I am a big Wakoopa fan, and have been using it for some time now. With that said, kylehase, TCCritic, boba and busdevgirl are right in questioning the accuracy of Wakoopa’s stats due to the small 75K sample size.

    Right now, Wakoopa has an “early adopter”, tech savvy audience. Although they do not have enough traffic to yet register on Quantcast (http://www.quan...com/wakoopa.com), you can tell that applications that appeal to a more tech savvy audience are skewing a lot higher with Wakoopa than what is publicly known about application market share.

    So far, Wakoopa has been slow to address this limitation, but there are solutions which they could help. The company I co-founded, W3i (http://www.W3i.com), has built a Windows application download process called “Install IQ” which has distributed over 200 million installs since being launched. We have already helped two other audience measurement firms build broad panel bases, and we offered to help Wakoopa get distributed to a more mainstream audience to round out their panel base as well. After a few initial conversations with them, the process has stalled out. Hopefully Wakoopa will recognize this challenge, and make building up a more mainstream panel base a top priority.

    • @RonWeber: We should talk directly. There were a few reasons why the process stalled with w3i – one of which is that I don’t believe we were talking to someone at the right level who really understood our needs. Ping me and let’s discuss. We’d love to work with you if it’s going to help us grow and add value – especially so if it’s not obtrusive or disruptive to Wakoopa users.

  • DestroyTwitter is NOT one of the hottest Twitter clients out there…… IT IS THE HOTTEST…. IMHO!

    It has just about everything I want in Twitter Client and it’s not a memory hogger like some of the others…. and it’s themeable!

    Go try it…….. http://www.destroytwitter.com

  • Destroy Twitter is by far the best Twitter app. It hasn’t been around that long, but has virtually all the features I need.

    Only a matter of time before it goes huge.

  • Can’t believe you guys had not heard about DestroyTwitter until now, when an insignificant person like I’ve had it for a couple of weeks!

    Even with a NOT very powerful computer like mine, it works flawlessly … not hogging all the resources.

    I’ve tried all Twitter apps I’ve seen advertised, and once you’ve tried this, you can never use anything else.

  • DestroyTwitter is a simply wonderful interface to Twitter, and has come on leaps and bounds over the last few weeks. The support for user defined themes and a number of shorteners and media services makes it a serious contender, whilst the addition of groups and some really powerful filtering behaviours push it ahead of the crowd.

  • DestroyTwitter is great and the hyper-productive and friendly developer show no sign of slowing down!

  • DestroyTwitter rocks. I’m surprised more people don’t use it.

  • Do you have any information on how Wakoopa’s sample audience is representative of other users?

    Knowing the sampling controls could help put all those stats in better context, thanks.

    (75,000 people is more than enough for a survey, if they’re truly representative of the larger group. I wondered why _anyone_ would install “tracking software” on their computer, for instance.)

    jd/adobe

    • Yup, it only represents people who are willing to install tracking software on their computers.

      By the way, you can always set your app information to private, as you should be able to with any decent web service.

    • @John Dowell:
      Please get in touch with us at bizdev AT wakoopa DOT com regarding your question.

      We have something new and exciting in the pipeline that may be of serious interest to you/Adobe.

      Cheers,
      Mindy Hull
      VP, Bus Dev
      Wakoopa

  • Wakoopa’s small sample size may be a delimiter for broad definition of overall use patterns. However utilizing subset’s of the actual users and social networking. It becomes a powerful software discovery and review engine that identifies users with whom you may already have social connections. Good stuff, Thanks for the Write-up and data.

  • “you’re more likely to stay on Gmail and YouTube longer than Google Search.”

    Well, I think that is by design. Google wants you to spend as little time searching as possible. (Remember the “I’m feeling lucky” button?)

  • It doesn’t sound right at all….

    I guess the user base is a bunch of geeky students (without offense here…).

    For instance, Chrome compared to IE is 1: 100 now. My friend like to call it a “play tool”. IE8 is surpsingly way better than FF too!

  • Very Interesting. Hey Wakoopa – if you’re reading these comments – you may want to rethink your data visualization on the “Throughout the Day” graph.

    I originally thought the center line was “0″ and that Word Processor use was about 10x that of Social Network use. Now I’m wondering if the different colored lines each start at “0″ and Social Network use is approximately the same as Word Processor use.

    Your visualizations need to make it more clear exactly what we’re seeing, but otherwise pretty cool.

  • Opera is #6 for Windows? TextMate is #10 for Mac?

    These stats may be true for uber geeks who spend a lot of time programming, but I’m skeptical that the general population is hot-keying their way through an xhtml document, for example. Hey mom, what’s the key-combo you use to execute a regular expression in TextMate?

  • wakoopa.com may be worth $1 billion due to the exponential rate of growth of web 2.0 apps. What a brilliant idea.Long live web 2.0 No bubble No recession http://iamned.com/blog/ stop whining about the economy

  • This is where applications need to flex some muscle. The folks at XOBNI have taken a crack at contextual usage data with their email application. Worth checking out.

  • This is where applications need to flex some muscle. The folks at XOBNI have taken a crack at contextual usage data with their email application. Worth checking out.

  • fun watching the chaos (slight return) - April 29th, 2009 at 2:04 am PDT

    Dumb name. Also usekess data.

  • Destroy Twitter is excellent.

  • On the first slide (the weekdays/weekends graph), are the apps stacked up on each other or do they measure from the centre line up (for weekdays) or down (for weekends)?

    E.g. are word processors only represented by the visible bright green band, or are they visualised all the way up from the centre line?

    • MacMyDay, I asked the same question above and didn’t get an answer, but I think they must start at “0″ from the band adjacent. The reason I say so is because I find it difficult to believe that there are absolutely no crossovers (where the data for one item crosses over the line of another item) in a 24-hour period.

      • Thanks, Wayne. Yes, that was my initial interpretation. Otherwise it wouldn’t make sense to use this type of graph – but you never know. Your crossover theory is probably true. Word processors can’t be the most used apps throughout the day.

Leave Comment

Commenting Options

Enter your personal information to the left, or sign in with your Facebook account by clicking the button below.

Alternatively, you can create an avatar that will appear whenever you leave a comment on a Gravatar-enabled blog.

Trackback URL
Short URL
bugbugbugbug
Techcrunch on Facebook