
With Time Warner reporting earnings yesterday, we now have online advertising numbers for the fourth quarter from the four largest players: Google, Yahoo, Microsoft, and AOL. Tallying up their online advertising revenues provides a decent proxy for the health of the overall online advertising industry as a whole, since they represent a majority of those revenues. (For comparison, see IAB numbers for the U.S. only). After a full year of slowing growth, their combined ad revenues actually picked up in the fourth quarter, showing a 3 percent rise compared to the third quarter. Combined revenues grew 8 percent on an annual basis.
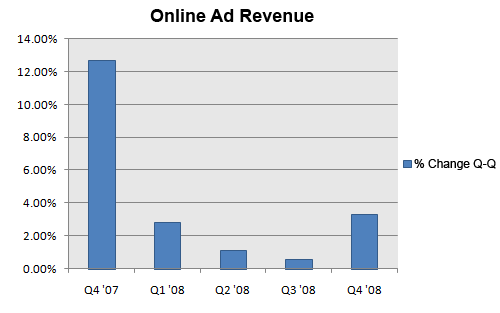
Like everyone else, I’ve been expecting to see continuing pressure on Internet advertising. In the third quarter, the sequential growth of the combined ad revenues from these four companies ground to a halt, going from 12.7 percent sequential growth in the fourth quarter of 2007 to 0.6 percent in the third. (All growth rates are quarter over quarter, unless otherwise noted).
What the slight rebound in growth tells us is that search advertising may be making up for the continued weakness in display advertising, which each of these companies acknowledged in their conference calls. The question is whether sequential growth will remain in this low range for the rest of the year, or whether search advertising can push it higher. One quarter’s worth of data is not enough to make any conclusons on that front, but at least these numbers provide a ray of hope.
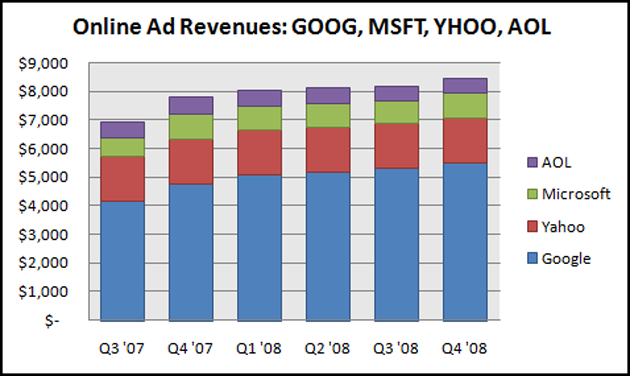
The combined ad revenues totaled $8.5 billion in the fourth quarter, up from $8.2 billion in the third quarter and $7.8 billion in the fourth quarter of 2007. Google continued to dominate, accounting for 65 percent of those revenues, up from 61 percent from a year ago but slightly down from its 65.3 percent share in the third quarter. Google contributed slightly more than half of the growth. Yahoo’s 19.1 percent share of revenues went up quarter-over-quarter by the same amount that Google’s went down (0.3 percent). Microsoft’s $866 million in online revenues gave it a 10.2 share, up from 9.4 percent in the third quarter. And AOL’s advertising revenues remained flat at $507 million, giving it a 6.0 percent share (down 0.2 percent).
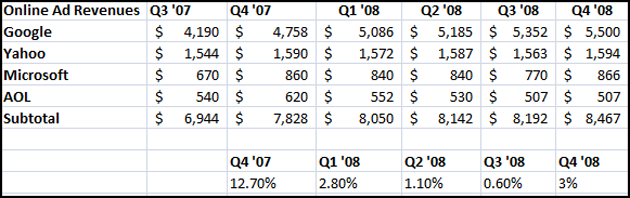
For the purposes of this analysis, I took the total advertising revenues from both Google and Yahoo, including their network revenues paid to affiliates, the online revenues reported by Microsoft, and only the advertising portion of AOL’s revenues. The revenue share figures above are rounded. Below are the absolute revenue numbers, broken down by company:
Update: We’ve updated the chart and table below to reflect more data going back to the third quarter of 2007. While there was an uptick in the quarterly growth rate in the fourth quarter, the 8 percent annual growth rate was still much slower than the 18 percent annual growth rate we saw in the third quarter. The big quarterly jumps began to temper in the fourth quarter of 2007, so that is only now beginning to be reflected in the year-over-year comparisons.


This chart is useless without Q3 2007. The question isn’t whether Q4 is larger than Q3 (of course it is), the story is how does Q3 2007 compare to Q3 2008 and how does Q4 2007 compare to Q4 2008.
The chart as presented does not mean anything.
Totally agree.
agreed
you are absolutely correct, is anybody on this thread aware that Q4 is always the highest? The answer to the headline will be a resounding “NO” when Q1 09 numbers come out.
The chart ABSOLUTELY IS helpful. It is not hard to read.
If you look at the left axis, you will see that it is percentage INCREASE!
Now let’s look at the strength of what that really means. Q4′07 was up 12%+ over the prior quarter.
Q1′08 also saw an INCREASE over the prior quarter – up 2%+ …
Q2′08 also saw an INCREASE over the prior quarter – up 1%+ …
Q3′08 also saw an INCREASE over the prior quarter – up something less than 1%, but regardless, still an INCREASE!!!
Q4-08 also saw an INCREASE over the prior quarter – up 3%+ …
There NEVER WAS A DECREASE!!!!!
WOW – that is a stunning piece of data backed by the largest players in the industry.
With all of the doom and gloom reporting, the data shows a stunningly different factual circumstance.
Now what isn’t reported is how ad dollars shifted. I believe there was a flight to quality and performance during the last two quarters of the year.
Our inhouse ad sales saw double digit increases for the last six months of ‘08 – but we serve a highly targeted niche. We could demonstrate quality traffic and quality conversions for our advertisers.
Regardless of my niche views about a flight to quality – the REAL DATA shows continued increases in internet advertising revenue.
The key here is expectations – so many people can not read the data and so when the see a slowing growth rate – they misinterpret the data and think that it is a decline.
Here is what the article actually wrote above:
“After a full year of slowing growth, their combined ad revenues actually picked up in the fourth quarter”
Note that key distinction! Slowing growth.
Not a decline – not doom and gloom … continued growth.
Now if some individuals saw a decline in a growing revenue market – I will saw thank you, because your revenue came to us. Inhouse we saw 27% increase in October, 19% increase in November, and 21% increase in December. We sold out 95.6% of our ad inventory in December. I attribute our performance to a flight to quality.
now that makes more sense
cooljobsalways
http://tinyurl.com/7uj5ay
@CNN: Absolutely correct. Erik again misses the mark. (I had commented last week on a similar inference he hastily drew when he compared Nov with December traffic numbers.
Erik: There is something called seasonality. Look it up.
Some of you are missing the point of the first chart. Each bar represents sequential, quarter-over-quarter growth, not absolute dollar values for those quarters. Seasonality is reflected in the chart. Sequential growth in 4Q08 was 3% vs 12.7% in 4Q07.
Then why is the title “Is the worst behind us?”
You are showing a plummeting of 4Q growth from 12.7% in 4Q 2007 to 3% in 4Q 2008. That’s a really bleak picture.
Either the chart is misleading or the text of the story is.
To tell the story more fully, find Q3 2007 and compare to Q3 2008 and see if the rate fall is worse or better than the rate of fall for Q4 2007 to Q4 2008.
Online ads market was never that badly hit (at least till now)….
Yahoo seems to have a significant chunk of share in the ad revenues…. Microsoft should have bought them (I guess)….
As for Google ads….it seems to be perpetual…. I think smart people do matter.
http://www.livbit.com
Just because it’s picked up a bit doesn’t mean that it’s over.
Couldn’t have said it better myself.
Yes, we need a more extended to the past time window to extract more accurate outcomes.
Q4 08 compared to other 08 Qs just looks like normal increase in spend for Christmas/Holiday season.
Well realistically the comparison should be growth compared to this quarter last year. Q4 is always going to be a winner with advertisers trying to do well with Christmas/NY spenders.
weird. Your name is my middle and last name.
Annual growth was 8% in 4Q 08, down from 17% annual growth in 3Q 08
Marketers are just looking for cheap and effective ways to reach their core customers. I think these numbers just show a shift in marketing trends rather than a change in the overall economy.
May be it is the yearly cycle that matters more. We should also compare Q4 2007 to Q4 2008. May be usually Q4 is higher than Q3 in general.
Online Ad market has never been hit. What was observed in Q2 and Q3 was a slight correction. The growth in coming quarters will be steady
I don’t know if it means anything, but on Tuesday I watched the last episode of 24 on Hulu and there were only ad council ads. For me its a bad sign.
I don’t think that the worst is behind us. I think two things may have happened in the fourth quarter that boosted the numbers a bit. For one, the online ad model is always improving, and I think a lot of companies and websites are figuring out better ways to target ads, which result in more effective ads.
Two, holiday shopping increased the number of people that were looking to make purchases online, and clearly would boost the number of ads. More people looking, more people clicking, more people selling more ads.
I wrote a post on the quality of web services as related to ad revenue here http://zachhell...increase-value/ and hopefully websites are getting smarter about their ad models.
The scary part is the drop you see after Q4 2007 and how bad Q3 2008 really was for the major players.
No, that’s not the scary part. It always falls big time between Q4 and Q1.
Let’s get more than 4 quarters of data to make conclusions. You need to compare the same time periods for different years.
What percentage of the revenue is attributed to CPM vs CPA models?
From what I’ve seen, certainly with Google, is they throttled up the number of adverts displayed in Q4. If others did the same, you might see your CPM rates comes down in Q1 & Q209 as you start to burn your end users with too many adverts, click-through rates begin to decline and as a result spend starts to drop as the ROI starts trending downwards.
Basically it cyclical. The coming quarters will be good. And yes comparison has to be on YoY basis
$ are leaving and turning to other sources – PPC is full of fraud and display is WAY overpriced. I used to spend a ton of $ online but have cut back 50% in my spend – rates are down and they will continue to fall.
09′ will see any business built on the Ad Networks go under – unless you have a team of experienced branded ad sales people you might as well cut your revenue in half.
And you’ll see hundreds of ad networks disappear in the next 6 months to boot – there are only so many advertisers and an infinite amount of inventory.
Anyone else seen a “dead cat bounce”?
We need to somehow get inventory in line with demand. Most sites have no content/visitor flow that it worth anything at all.
It would be nice to know if the businesses are paying for this advertising themselves or if they are TARP recipients. For example, CAPITAL ONE, who makes the cheesy ads about building your own credit card, requested TARP funds and they received it. Why the US Government would give a credit card company, who just recently was baraging our mailboxes with offers of credit, a bailout is mystifying, as is most of the TARP activity. Love to see this data by industry or something that would indicate where the source of funds is coming from.
ad spending goes up in the initial part of a downturn as businessess increase marketing to combat falling sales. then reality sets and and marketing budgets are slashed. likewise in the trailing edge of a downturn, ad spending lags sales…
what is the point of predicting ad spending??? saying things like…up 10% by year 2015. does that really mean anything one? a gartner or idc analyst like the weatherman.
Erick, This statement:
“Like everyone else, I’ve been expecting to see continuing pressure on Internet advertising”. Who is “everyone else” exactly? Is that an absolute statement or in comparison to TV, radio, print? I can tell you that a lot of companies outside the big 4 are seeing major growth and success right now. This comes from the funneling of ad dollars offline to online (to a more measurable medium), and the shift overall (for large brands and Direct Response) to performance marketing methods and performance-based ad networks. I was at a conference yesterday that was very positive about the prospects of online advertising (even display; the “sky is falling” argument comes from the economically unstable CPM’s that are finally coming in line with economic reality). Consider also that performance-based marketing exceeded CPM-based marketing spend last year and the chasm widens every month. Search plays a part in that, for sure, but there’s a lot more going on than just search. If you’re only watching the big 4, you’re missing a whole lot of other trends happening.
“like other industry observers” would have been more accurate.
I wasn’t being argumentative. WSJ had an article today about performance marketing’s rise and the numerous advertisers/companies having success right now also underscores the point. And a lot of analysts, not just observers, have been making the point that there are successful marketing stories happening even in this environment. Not just modest quarter-over-quarter growth either, it signifies a real landscape shift IMO.
The thing about this crisis is that it is mostly caused by greedy but otherwise incompetent bankers that have no clue how to do something of real value to society. The rest of the world that does hones work and an hones paycheck was not in trouble at all till the financial industry slammed everything down (Ok some car makers were already in trouble before that without really admitting it).
It won’t be easy and quick but I do believe once all the investment and insurance geniuses have either gotten their golden parachute or are sent back to elementary school (were they belong) and the financial system is cleaned up with an iron broom there is no real reason for a crisis anymore.
Let’s swing the broom. No respect for bankers.
I agree with EMike on this one. I read the article in the Journal this morning as well and even shared with colleagues. What we’re seeing isn’t a slow down, simply a shift of focus from mass advertising to focusing on niche marketing. Smart companies are opening up dialogue with their user base. They’re still spending marketing dollars. Gone are the days of mass CPM Buys. It’s just a changing world, not a dying one.
I really think the increase in related to Christmas season. We’ll have to wait for Q1′09 figures to see the trend.
khskhkskck
a few more data on display vs. search advertising: http://www.emar...aspx?id=1006902
>> Yes, search advertising is making up for the display… but only for the major players.
I thought the worst would last much longer than this post implies.
I wonder if it really is the end of the worst.
If so… AWESOME.
Interesting but not surprising. Considering the broad secular shift going on and how much non-digital spend is left out there to convert to measurable digital spend, I think its safe to say the online ads are going to grow in total value with only short interruptions like this for the next five years or so.
Everyone takes for the granted that no one does meant to made for them self.My company also get the impact.people more carefully spending or perhaps they have less many to buy .however,the search technology is a business that run still on the track of development and innovations I am sure each of them will survive remain operate their server to serve millions people to the edge of the century.Hopefully
А комментарии тут на самом деле интересные. Будем следить за комментами и дальше
Так без недостатков достоинства незаметны