http://www.icharts.net/studio/embed/MHnXyQ==
The liquidity drought for venture-backed startups, which was already declared to be a crisis in the second quarter when not a single VC-backed IPO went out, continued in the third quarter.
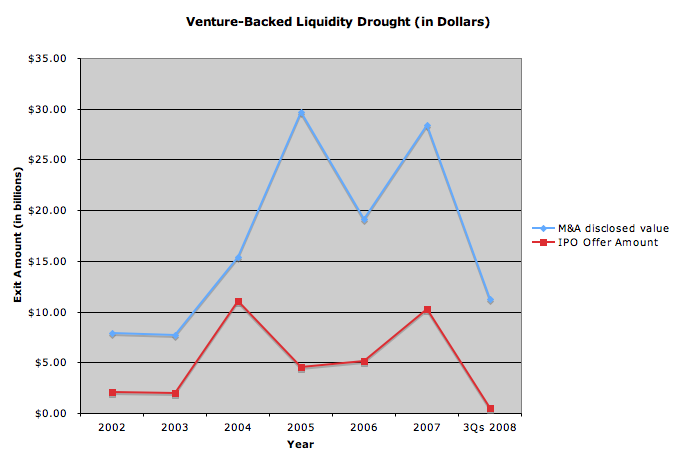
For the first three quarters of the year combined, IPOs brought in only $470 million and M&A activity totaled $11.3 billion, a steep decline from prior years (see chart). Don’t expect the situation to get better any time soon.
Although there was one IPO in the third quarter, RackSpace, which brought in $187.5 million, that was less than half of what the company had expected to raise when it initially filed. In the third quarter of 2007, by comparison, IPOs brought in $945 million. Mergers and Acquisitions activity was also down in the third quarter, bringing in $3.5 billion compared to $10.8 billion in the third quarter of 2007, according to The National Venture Capital Association and Thomson Reuters.
http://www.icharts.net/studio/embed/O3nV
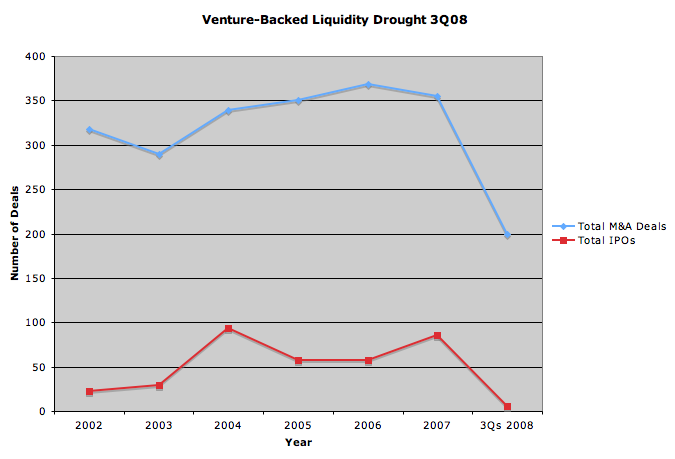
In terms of number of deals, there have been 199 M&A deals so far in 2008 and only 6 VC-backed IPOs. By comparison, for all of last year there were 359 M&A deals and 86 IPOs. In the third quarter alone, there were were 58 M&A deals, compared to about 70 in each of the previous two quarters (numbers which have been revised upwards since the last report came out). And the single IPO is at least better than the big fat zero that came out in the second quarter.
Breaking the numbers down a bit, IT startups accounted for 38 M&A deals in the quarter (or 65%), and $1.7 billion of the total disclosed deal value. Of those, only 9 were Internet startups, which accounted for only $251 million of disclosed deal value.
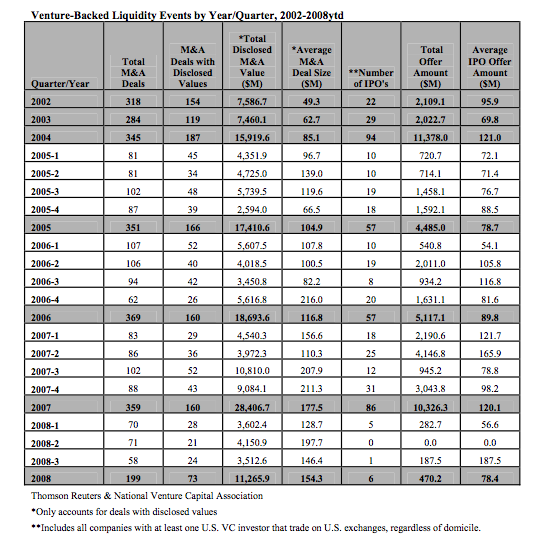
The charts above compare the first three quarters of 2008 to previous full-year totals. So the last data point is not completely apples-to-apples, but it gives you a sense of how much would have to be made up in the fourth quarter to get back to parity. (Anyone wan to take bets on that happening?). You can see the underlying data in the table below:
Update: I’ve now added two interactive iCharts of the graphs above with quarterly data.