AOL Money and Finance has been around almost as long as AOL itself – forever in Internet time. But they’ve sat on the sidelines as Yahoo periodically updated their own property, and Google launched their own competing site.
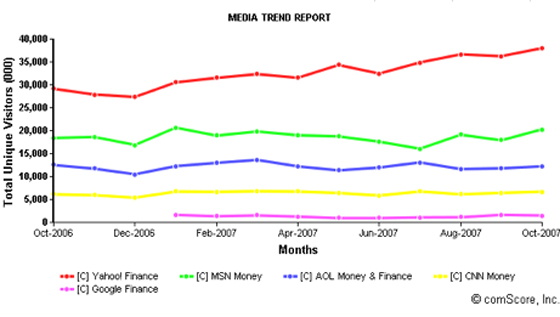
Even though AOL has not kept its service as cutting edge as the competition, they still move a lot of traffic. Recent worldwide comscore stats put them third behind Yahoo Finance and MSN Money with 12.2 million unique monthly visits. That’s well ahead of CNN Money (6.7 m) and, surprisingly, Google Finance, which is dead last among the large finance sites (1.5 m).
Third place doesn’t suit AOL’s SVP Money and Finance Martin Moe very well, and his team is making a run for more users. This morning at 6 am EST they are launching an entirely redone AOL Finance – complete redesign and a lot of new features. Moe gave me a demo of the new site and explained some of the key features. I’ve put the old site next to the new site for an example company (Walmart) – see the image here.
News Via Relegence
First of all, they’ve tightly integrated financial news about companies from Relegence, a company AOL acquired last year. This is the first time Relegence has been integrated into an AOL property, Moe says.
The result is a deep browsing engine for news related to the company you are viewing. Blogs, analyst reports, press releases, etc. can be added or removed to filter results. And users can also choose to have news included that merely mentions the company v. articles that really focus on that particular business – see the slider in the image to the right.
Charts & Graphs
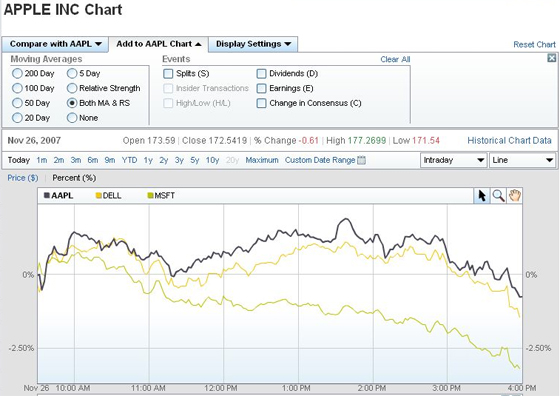
Historical stock data, which goes back as far as 25 years, is on display via Flash graphs. This is significantly better than the current Yahoo and Google are offering. The charts, which are large and easy to read, can be easily manipulated to see different time frames. Other companies and indexes can be added to the chart for comparison purposes, a feature I particularly liked. A basic chart is included on the overview page. Simply click “Go To Interactive Chart” to see the deeper functionality.
The chart below shows Apple’s stock price compared to Microsoft and Dell over the same period.
Another feature that I haven’t seen elsewhere is a simple return-on-investment table that shows investment returns for given periods. Or simply set the calendar to whatever dates you like. Again, this is a fairly simple feature but one that you can’t currently find on Google or Yahoo (wow! Apple stock has sure done well the last three years).
This is a significant upgrade, and will raise the bar for Yahoo, Google and the other competitors. Congrats to the AOL Money & Finance team for releasing a great product.